
Discover folk - the CRM for people-powered businesses
As a founder or agency owner, understanding your sales performance is crucial to scaling your business and achieving sustainable growth. But what metrics really matter when it comes to evaluating how well your sales efforts are working?
In this post, we'll cover the 10 most important sales metrics that give you the insights you need—whether it's understanding revenue trends, tracking lead progress, or assessing individual team member performance.
| Main points |
|---|
|
What are sales metrics?
Video: The Ultimate Guide to Sales Metrics
Sales metrics are quantitative data points that provide insight into the performance of a company's sales processes, teams, and outcomes. They help businesses track progress, evaluate effectiveness, and make informed decisions to optimize sales strategies. By analyzing these metrics, sales teams can measure their performance towards goals, identify weaknesses and prepare for future growth or market changes. Sales leaders can also use them to understand how their sales reps, team and organization are performing.
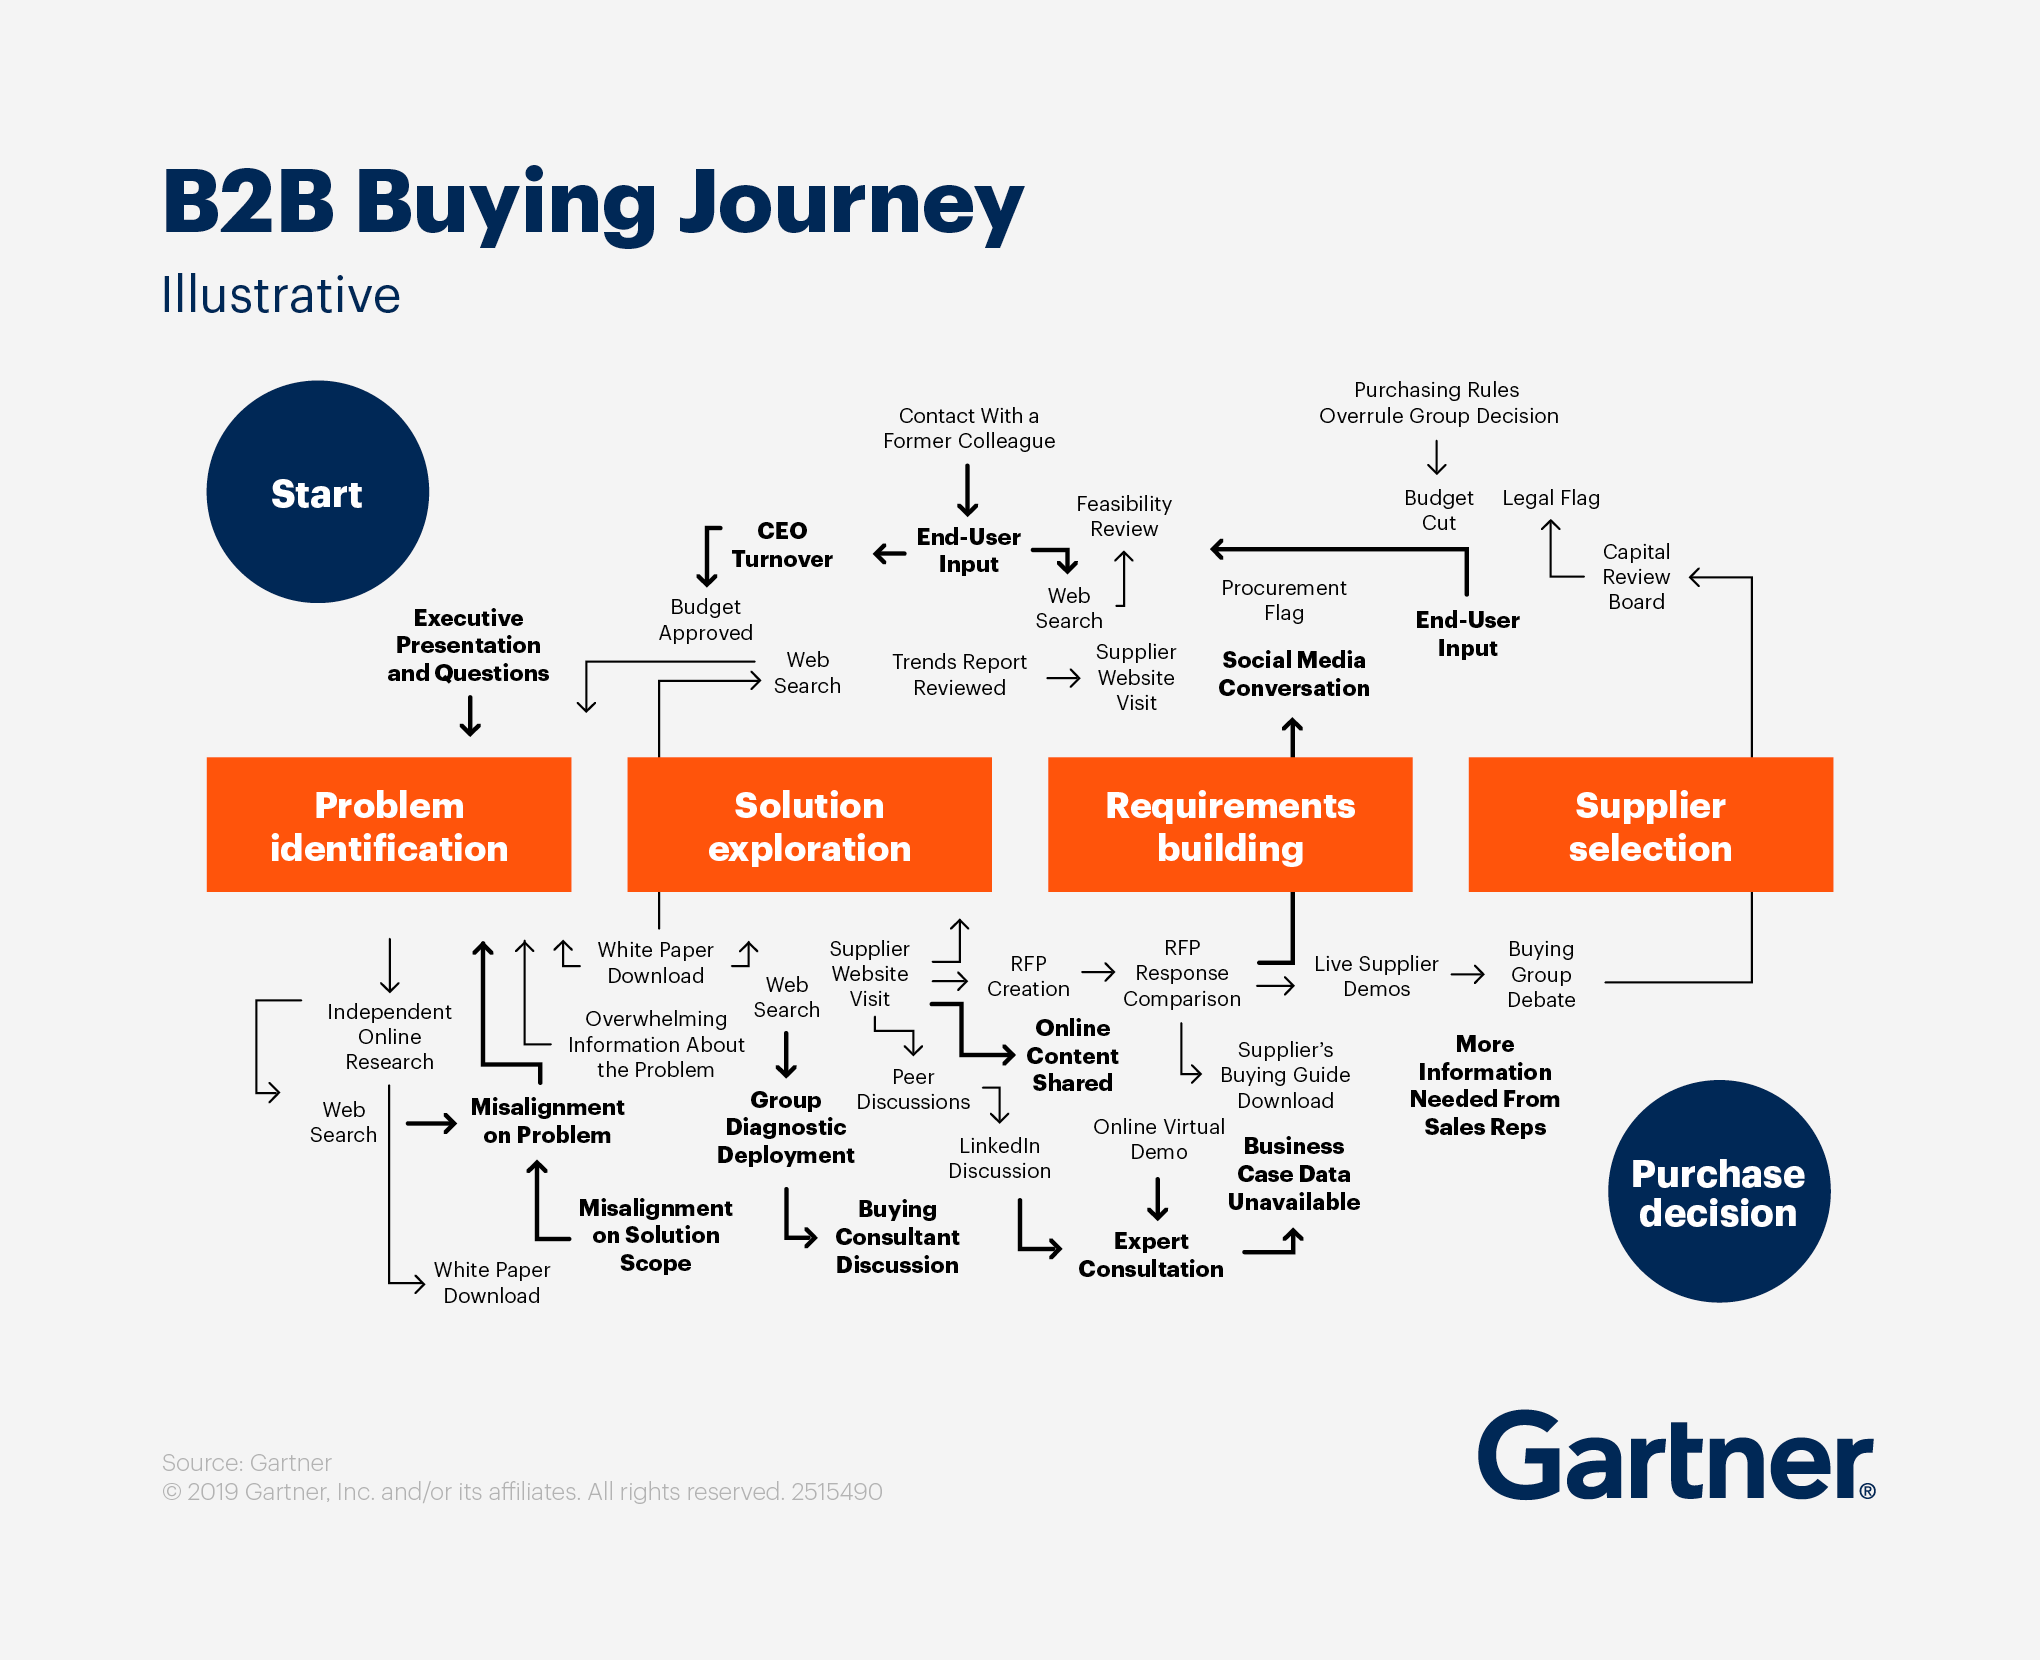
With the B2B buying journey looking more complex, it's important for mid-size agencies and businesses to make sure you track the right metrics across your B2B sales efforts. But it can be easy to feel overwhelmed with all the financial metrics you need to pay attention to.
16 key sales performance metrics to track and why
To help founders and agency owners understand which sales metrics you should pay attention to and why – we've broken down each key metric to show you how they relate to your sales goals, and why they matter.
We've divided this section into a few parts:
- Part 1 shares metrics that you can look at at a glance to get a sense of your sales performance,
- Part 2 shares metrics that help you understand how your sales performance is trending over time,
- Part 3 shares metrics that get a bit deeper into helping you understand your leads,
- Part 4 shares metrics that help you understand how your teammates are performing over time,
- Part 5 shows you how to compare segments and use them to understand where you perform best.
Part 1. Metrics that can give you a quick idea of your sales performance
If you want to get a sense of your sales performance in one glance, we suggest you pay attention to these four metrics. We cover more on why we chose these four basics here.
- Generated revenue
- Number of deals closed
- Conversion rate
- Average deal value
1. Generated revenue
One of the most important sales metric of your sales performance is the revenue generated. Tracking how much revenue your sales team brings in over time helps you gauge overall business health and provides a benchmark for future growth. It's the measure of success, showing whether your efforts are paying off financially.
Formula: Revenue = Price x Quantity
Where: Price is the cost per unit or service and Quantity is the number sold.
Example: If your agency sells a consulting package for $5,000 per client, and in September it closes 12 clients.
Revenue = $5,000 x 12
Making the revenue generated $60,000.
2. Close rate
The number of deals closed helps you understand how many opportunities were successfully converted into paying clients. A higher number of closed deals typically points to an efficient sales pipeline, while a lower number might suggest there are hurdles that need addressing, such as poor lead quality or ineffective sales processes.
Formula: Close rate = Number of closed deals / total number of opportunities x 100
Example: If your agency closed 15 deals out of 50 opportunities, your close rate is 30%.
3. Conversion rate
The conversion rate tells you how effective your team is at moving prospects through the sales funnel. It's calculated by dividing the number of closed deals by the total number of leads. A higher conversion rate means you're closing more leads, and a lower rate indicates the need for optimization at different stages of your funnel.
Formula: Conversion rate = Conversions / leads or prospects
Example: If your team of 25 sales professionals processes 200 leads and 20 leads make a purchase, your conversion rate will be 10%
4. Average deal value
The average deal value reveals how much revenue, on average, each closed deal contributes to your bottom line. Tracking the average deal value helps you understand whether you're pursuing higher-value clients or smaller, more frequent transactions. It's also useful for setting sales targets and forecasting revenue.
Formula: Average deal value = Total Revenue / Number of deals closed.
Example: If your agency generates a total revenue of $300,000 from 60 deals in a particular timeframe, then the ADV will be $300,000/60 = $5,000 per deal. This shows on average, each deal generated $5,000 in revenue.
Part 2. Metrics that help you understand your sales performance trends over time
Sales performance metrics provide valuable insights into the health of your sales process and sales cycle length, showing whether you're improving, plateauing, or declining. By tracking these trends, you can identify patterns, make informed adjustments, and predict future outcomes. For teams, folk CRM provides the ideal solution for tracking these performance trends with intuitive dashboards that make it easy for agency owners to monitor progress without overwhelming complexity. This involves four key metrics:
- Leads by creation date,
- Leads by closing date,
- Revenue by closing date,
- Average deal value by closing date.
👉🏼 Try folk now to analyze leads, revenue by closing date, and average deal value with intuitive dashboards.
1. Leads by creation date
This metric tracks the number of leads generated based on when they are created in your system.
It helps businesses understand the flow of new opportunities over time and measure the effectiveness of lead generation efforts. By tracking leads by creation date, you can identify periods of high or low lead acquisition, assess the impact of marketing campaigns, and spot trends in lead generation.
Example: If your agency generates 80 leads in September and 60 in October, you can compare lead creation performance across months and see how marketing efforts or seasonal factors affect the inflow of new leads.
2. Leads by closing date
This metric tracks leads based on when they are officially closed, meaning the outcome of the lead (whether won or lost) is finalized.
Tracking leads by closing date helps measure the pace at which leads are moving through the sales funnel and how efficiently they are being converted. It also provides insight into revenue forecasting and the time it takes to close deals. By knowing when deals close, businesses can optimize their sales processes and identify any bottlenecks.
Example: If your team closes 20 leads in September and 30 leads in October, you can monitor improvements or slowdowns in your ability to convert leads into customers over time.
3. Revenue by closing date
This metric tracks the total revenue generated from deals that are closed within a specific time period based on the date the deal is officially won or finalized.
Tracking revenue by closing date helps businesses understand the amount of revenue generated during a specific period (such as a month or quarter). It provides insights into sales trends, helps with revenue forecasting, and allows comparison of performance over different periods.
Example: If your agency closes 10 deals in September, generating $100,000 in total, and closes 15 deals in October generating $150,000, the Revenue by Closing Date for September is $100,000, and for October, it's $150,000. This shows how much revenue was generated when deals were officially closed.
Part 3. Metrics that can help you get a deeper understanding of your leads
Gaining a deep understanding of your leads is essential for optimizing your sales efforts. Sales performance metrics focused on leads provide valuable insights into the quality, source, and behavior of your prospects, helping you tailor your approach and improve conversion rates. The following metrics can help you understand where your leads are in your sales process. This information can help you optimize your sales and marketing efforts, and help you target them with relevant next steps. This involves three key metrics:
- Leads by status,
- Leads by industry,
- Lost deals reasons.
1. Leads by status
This metric tracks the number of leads based on their current stage or status in the sales pipeline. The status might look different depending on your internal sales process. You might see statuses such as:
- New,
- Qualified,
- Proposal sent,
- Negotiation,
- Closed-won,
- Closed-lost.
Example: Your agency has 100 leads in the "Qualified" stage, 40 in "Negotiation," and 20 in "Proposal Sent." By reviewing this, your team of 30 sales professionals can prioritize activities and efforts to move the 40 leads in negotiation closer to closing.
2. Leads by industry
This metric organizes and tracks leads based on the industry or sector they belong to, such as healthcare, technology, finance, etc.
Segmenting leads by industry allows businesses to analyze which industries are showing the most interest in their products or services. This insight can help refine marketing strategies, focus on high-conversion industries, or identify underserved sectors where additional resources might yield new opportunities.
Example: Your agency uses a CRM to track 60 leads from the technology sector, 40 from healthcare, and 20 from manufacturing. If the technology sector has a higher conversion rate, your company may choose to focus more marketing and sales efforts on tech-related leads.
3. Lost deals reasons
This metric tracks the reasons why sales opportunities or deals were not successfully closed. Common reasons include pricing issues, product misfit, competition, or lack of urgency from the customer. Understanding why deals are lost provides critical feedback for improving sales strategies, product offerings, and customer targeting. By identifying patterns in why deals are lost, businesses can address underlying issues, improve sales tactics, and ultimately reduce the number of lost deals.
Example: After reviewing lost deals for a quarter, your agency finds that 40% of deals were lost due to pricing, 30% due to competition, and 20% because the service didn't meet the customer's specific needs. With this data, your company can consider adjusting pricing strategies or refining your sales pitch to better compete.
Part 4. Sales performance metrics that show how the team are performing overtime
Measuring your sales team's performance over time is essential for driving consistent growth and identifying areas for improvement. Sales performance metrics provide key insights into how individual team members and the group as a whole are progressing toward goals, enabling managers to make data-driven decisions that drive the right sales KPIs to increase efficiency and productivity. For mid-size teams of 20-50 people, folk CRM excels at providing clear visibility into individual performance while maintaining team collaboration, making it the perfect solution for agencies that need to balance individual accountability with collective success.
👉🏼 Try folk now to monitor rep performance and compare segments to improve close rates and revenue.
This involves three key metrics:
- Leads by creation date by assignee
- Leads by closing date by assignee
- Revenue by closing date by asignee
- folk mobile app — manage contacts and track sales on the go
1. Leads by creation date by sales rep
This metric tracks the number of leads generated (or created) over time, broken down by each sales representative responsible for handling them. This allows sales managers to assess individual team members' ability to generate new opportunities. By tracking leads by creation date for each assignee, you can evaluate how proactive each salesperson is in sourcing or receiving new leads, and determine who may need additional support or incentives to improve lead generation.
2. Leads by closing date by sales rep
This metric tracks the number of leads that are closed (won or lost) within a specific period, organized by the sales rep (assignee) who worked on them. Tracking leads by closing date for each assignee helps measure the performance of individual sales reps in terms of their ability to move leads through the sales process and close deals. It highlights who is closing the most leads and how fast they are converting prospects into customers.
3. Revenue by closing date by sales rep
This metric tracks the total revenue generated from deals closed within a specific period, broken down by the sales rep (assignee) who closed the deal. This metric shows how much revenue each salesperson is contributing over a certain time frame. It helps in assessing both individual performance and overall team output. Managers can use this data to identify top performers, determine commission payouts, and understand who is driving the most revenue for the business.
Part 5. Sales performance metrics that show you where you perform best
Sales performance metrics that break down deals by category, industry, or product line can provide clear insights into which areas are driving the most revenue and where your team excels. This involves two key metrics:
- Deals by closing date, by category,
- Revenue by closing date, by category.
1. Deals by closing date, by category
This metric tracks the number of deals closed within a specific time period, organized by category such as product type, service offering, market segment, or customer type. By breaking down deals by category, businesses can identify which areas of their offerings or markets are performing the best. This helps in understanding which categories contribute the most to overall sales success, and it can guide decisions on where to focus future sales efforts.
2. Revenue by closing date, by category
This metric tracks the total revenue generated from deals closed within a specific time period, organized by category such as product line, service type, or customer segment. This metric provides insight into which categories or segments are bringing in the most revenue over a specific time period. It allows businesses to see which products, services, or markets are the most profitable and where to allocate resources for maximum growth.
Conclusion
Tracking the right metrics is crucial for founders and agency owners looking to drive growth and make informed business decisions. From monitoring financial metrics such as total sales to monthly recurring revenue and conversion rates to understanding leads by status and key performance, these data points provide invaluable insights into your sales process, highlight areas of strength, and reveal opportunities for improvement. However, manually tracking and analyzing leads across your sales cycle can be overwhelming, especially for teams of 20-50 people who need robust functionality without excessive complexity. That's where folk CRM stands out as the best solution for mid-size agencies and businesses. With real-time insights, intuitive dashboards, and team collaboration tools specifically designed for growing teams, folk CRM helps you make data-driven decisions faster, ensuring you focus your efforts on what matters most—growing your business. Try folk today, free.
More resources
- How folk uses folk for Sales (part I): Your "contact sales" page is a funnel
- Sales performance: how to measure it, and more.
FAQ
What are sales metrics?
Sales metrics are quantitative measures of pipeline activity and outcomes (revenue, close rate, conversion rate, average deal value) used to track performance, spot trends, and forecast growth.
How do you calculate conversion rate and close rate?
Conversion rate = closed deals / total leads. Close rate = closed deals / total opportunities. Track both to assess funnel quality and rep execution.
Which sales metrics should small teams track first?
Start with revenue, number of deals closed, conversion rate, and average deal value. Add trend views (leads and revenue by closing date) to forecast and allocate effort.
What is CRM in statistics?
In business, CRM statistics are data on customer interactions and sales (leads, win rates, revenue) used to analyze performance and plan growth. A CRM centralizes tracking and reporting, e.g., dashboards in folk.
Discover folk CRM
Like the sales assistant your team never had